Debugging in Studio
The most useful built-in UiPath Studio features to debug your workflows
Looking Under the Hood
Continual testing is the most important thing a developer must do when building software. Any developer needs to be able to step through the execution of a workflow and examine what is happening in memory at any given time. Studio has many features to help you test and debug your workflows. It’s worth taking the time to learn these features.
Test Running Your Workflow
There are 7 ways to kick start a test run of your workflow or project. They are:
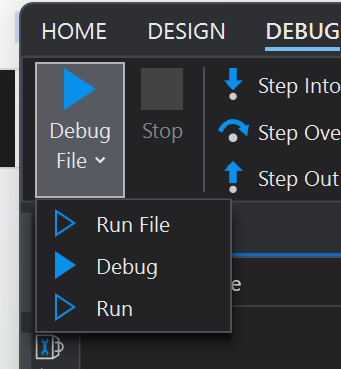
Debug File: (default) Runs the currently selected file in debug mode.
Run File: Runs the currently selected file.
Debug: Runs the whole project in debug mode.
Run: Runs the whole project.
Debug mode means that breakpoints will work. If not in debug mode, all breakpoints will be ignored.
There are also ways to focus on a specific activity that you want to test. Right-clicking on an activity in your workflow brings up the context menu. There are 3 more options there under Debug:
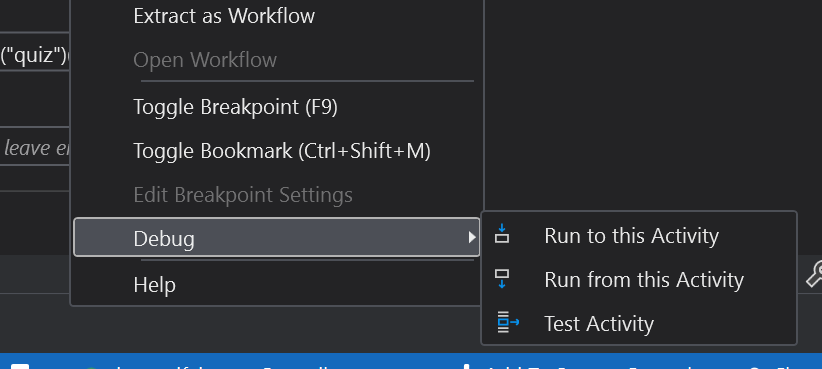
Run to this Activity: Runs the workflow and stops just before the activity and opens up the Locals panel. It’s like setting a breakpoint there.
Run from this Activity: Skips all that came before, opens up the Locals panel so you can add any needed variables, then you can click Continue to proceed from there. Useful to skip re-opening a browser or getting user input, for example.
Test Activity: This opens the Local panel, runs the activity itself on Continue, then stops after that.
NOTE: As of 1/6/25 Run from this Activity and Test Activity have bugs. They say they’re working on it.
Setting Breakpoints
Rather than over using log messages to see what’s happening in your workflow, learn to toggle breakpoints anywhere you want the execution to pause. You can do this by right-clicking on any activity in your workflow, and clicking Toggle Breakpoint, or clicking F9.
Breakpoints Panel
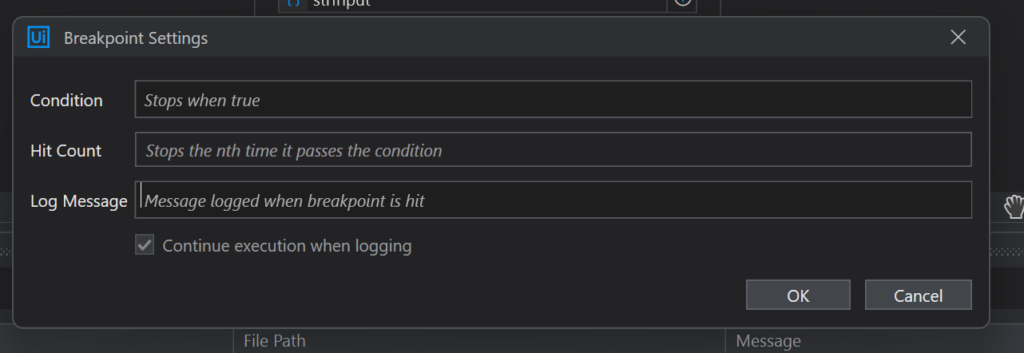
The Breakpoints Panel is a way to fine-tune your breakpoints. You can set a condition so that it will only pause when true. You can set a hit count so that in a loop it will only pause when it reaches that iteration. Or you can simply log a message when the breakpoint is reached, and choose whether to keep going or pause the execution as well.
Workflow has paused, now what?
Once a breakpoint is reached in Debug mode, the workflow pauses so we can inspect what’s going on, view and edit our variables, and continue execution. The following features become available:
The Debug Panels
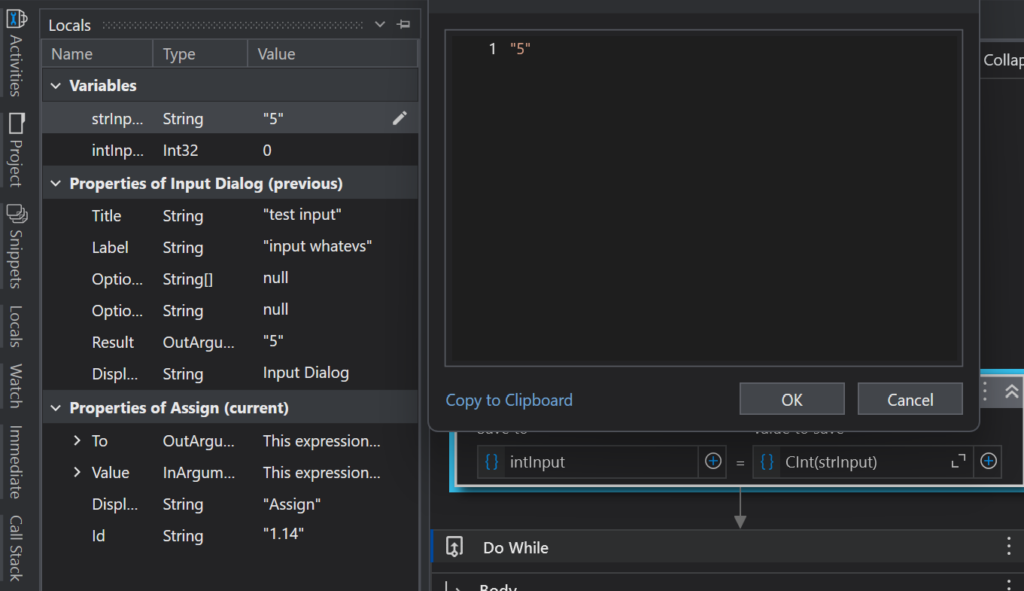
Locals Panel
The Locals panels shows all the variables, activity properties, and exceptions currently in memory at the time of execution pause.. Any entry that shows a pencil icon when you hover over it is capable of being edited through a pop-up.
Watch Panel
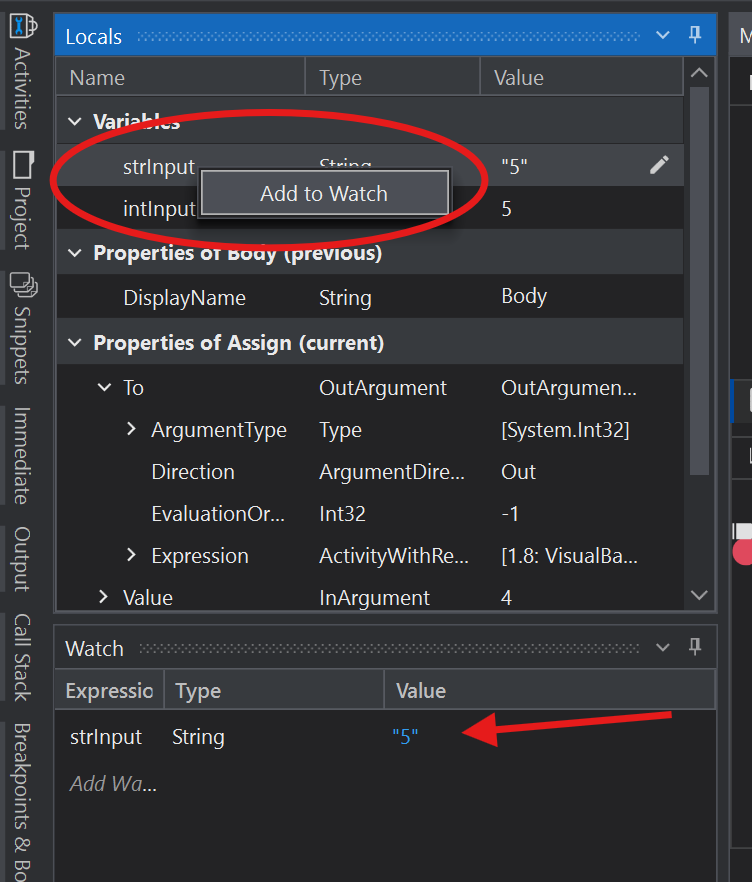
To isolate exactly what you are interested in, use the Watch Panel. Right-click on any variable, click Add to Watch, and it will be added to the Watch list. It’s helpful to dock your Watch Panel below your Locals Panel. You can also right-click on any variable in the Variables Panel or the Data Manager as well. You can also create expressions in the Watch Panel. You might want to see how many rows in a Data Table variable, or a particular column value, for example. You can easily delete anything from the Watch Panel by clicking delete key, or selecting Clear All to delete all of them. The Watch Panel is helpful when you know what you want to keep an eye on, even before your run.
Immediate Panel
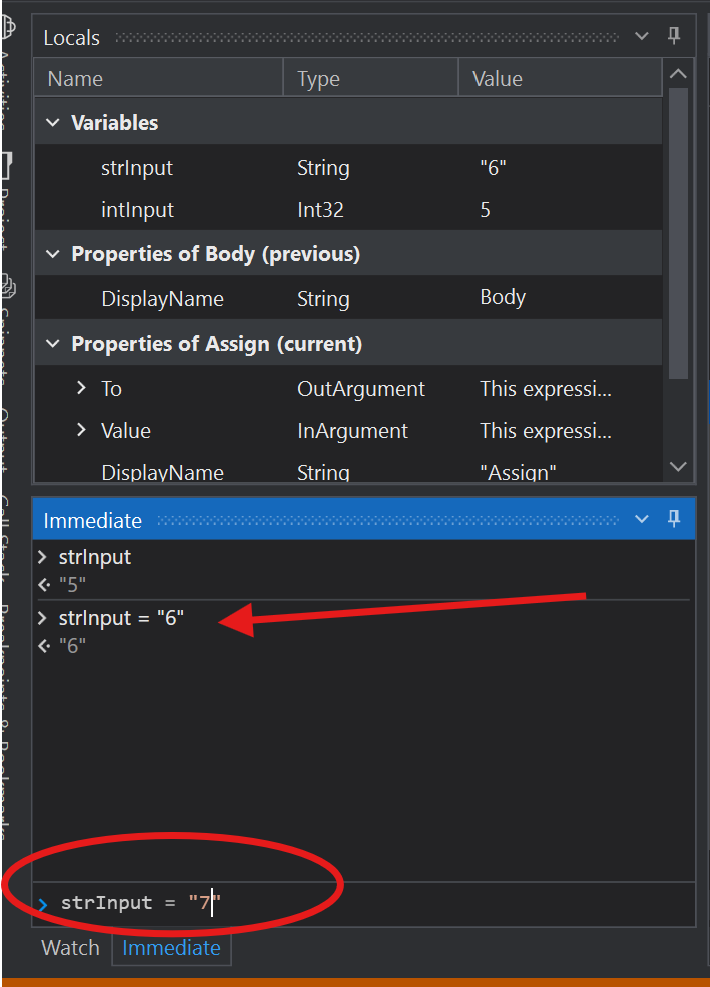
Another way to isolate a variable is in the Immediate Panel. Here you type in the variable in the input field on the bottom (intellisense will help you), and its value will appear in the panel. You can also alter a variable’s value directly by assigning it a value in an expression. It will also change it in the Locals Panel, the Watch Panel if it is being watched, and going forward in your run. This panel is helpful for stopping during an error and figuring out what’s going on at a particular time.
Call Stack Panel
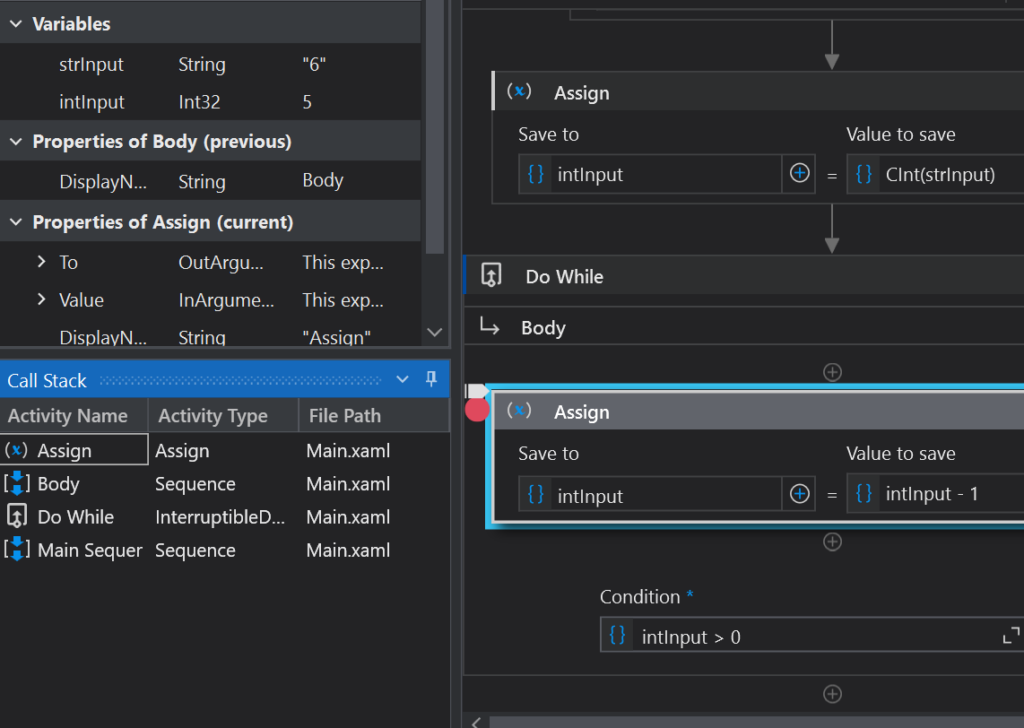
At any point during pause, you can examine the Call Stack. This shows the current activity, and all it’s parent containers. Note that it doesn’t show all the activities that have been called, only the hierarchy as it exists at the current moment. These are shown in reverse order, with the last one called first in the list. You can easily switch focus to anything in the call stack by double-clicking on it.
Stepping Through the Code

After you’ve paused execution, the Debug Ribbon gives you several options to step slowly through your workflow to see exactly what is happening. These are particularly useful with Invoke Workflows or Container Activities, to control when you want to skip through some parts quickly.
Step Into — Executes the currently highlighted activity or function, moves to the very next one even if it is a child activity or in another workflow, and then pauses again.
Slow Step — Slows down the execution (1x is the slowest), and highlights each activity as it goes. Can be set ahead of time, or during debugging. Works the same as Step Into but highlights without completely halting the execution at each step.
Step Over — Useful when you want to execute an invoked workflow or container activity, without opening it and stepping through it.
Step Out — When inside a nested container, this is useful to just go ahead and complete this container to the end, then pause once we’re out of it.
Continue — Just continue to the next breakpoint, or to the end if no more are set.
Stop — Stop the execution entirely.